
A Semiotics Approach to Markets
The Whole Jackson Hole Thing
I had proffered that the structural profile argued that rates might rise for decades. Meanwhile the majority has wasted much intelligence, artificial or otherwise on prognosticating when the Fed would be easing again? That game has already changed. You may expect arguments from the carefully curated pundits but not any revelations. They are far from being futurists. wonder if we are suddenly living in a ‘5% world? What if we are living in an 8%’ world? No one knows the number. Jerome doesn’t know. He stood behind me in high school and he won’t be doing anything rash now either. Jackson hole won’t change that. Wyoming has never been the show me state. Sure, the chosen headliners will opine on everything monetary, but they are operating on selective past paradigms. Okay, they are fine folks. They just don’t know the future and neither do we. They will play this with, ‘what ifs’ without promising anything. That is their job. They are faux futurists. Rates and Inflation are trending but exactly when and at what levels they will show themselves is up to them. The market may fool many of us who are constantly grasping at headline answers. Welcome to the Future. It is always different than you think. Still, this rate play was not unexpected. Now, expectations can create trends that persist. Higher rates have been and are the new reality. Every climate changes.
MARKET ENVIRONMENT: by Woody Dorsey. The October Low had decent cogency. The rally from there is coming to a close. Nothing has really been happening except confusing bids. The Fed is tightening and money is in crisis. Still, an Expected Recovery continues. Nothing has really changed. Rates are Rising and Inflation is sticky. That may continue for some time. No Change: “Profiles are for sloppy tactical strength to resolve into harsher mixed trade. It could end up being a corrective Summer but not any catastrophe. In other words, Markets are Still A Mess. Sentiment came in today @ 62% Bullish. stocks are still in some sort of a congestive process. Investors ‘get’ that a Low is in but they don’t like that idea. Stocks don’t care. Everyone is forecasting everything, but no one really knows anything. Jerome doesn’t know if a Recession is coming. It could be a continual Glogcession? That may mean more of a confusing sideways market this year. Keep getting used to it. The profile proffers a messy week. I mean, debts do still have ceilings, don’t they?
NEAR TERM: Investors are still obsessing on potential big pictures’ which are not happening. Every week is a new week. Each day is different. This week looks like it will build on last week, by keeping investors confused. INTERIM TERM will eventually better ‘bottom’ on a defined final Rate Rise. A recovery continues. and is expected to be followed by a classic failure later this Summer.
Sentiment came into today at 62%: DORSEY MARKET SENTIMENT: The Herd on the Street: The negative sentiment nadir in October was not surprising; You could smell that sentiment extreme happening which is why last October was a key zone. Markets are basically still in an elongated profile from there. The OPTIMISM has increased markedly in recent weeks as stocks have continued their complacency. Investors are exhausted by the Negatives.
MARKET SUMMARY: Repeat: “This is not a Market Environment for any extreme Market Beliefs.” Markets are still on a Tightening rope. Stocks are in a big messy sideways game. The market does not want to let you understand It. The rally from October is trying roll over at its own pace. Don’t be swayed by any tactical Chop. Stay patient.
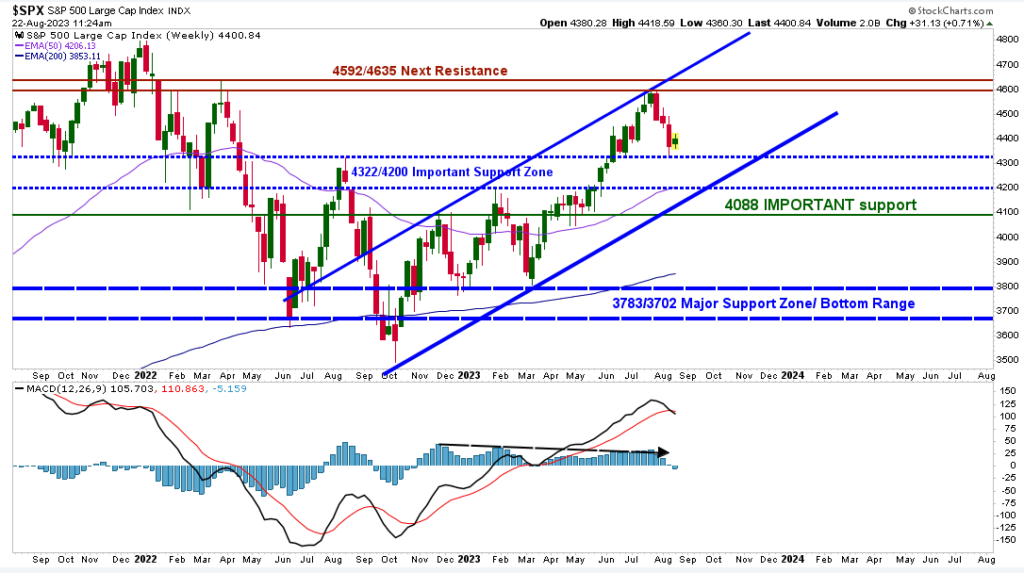
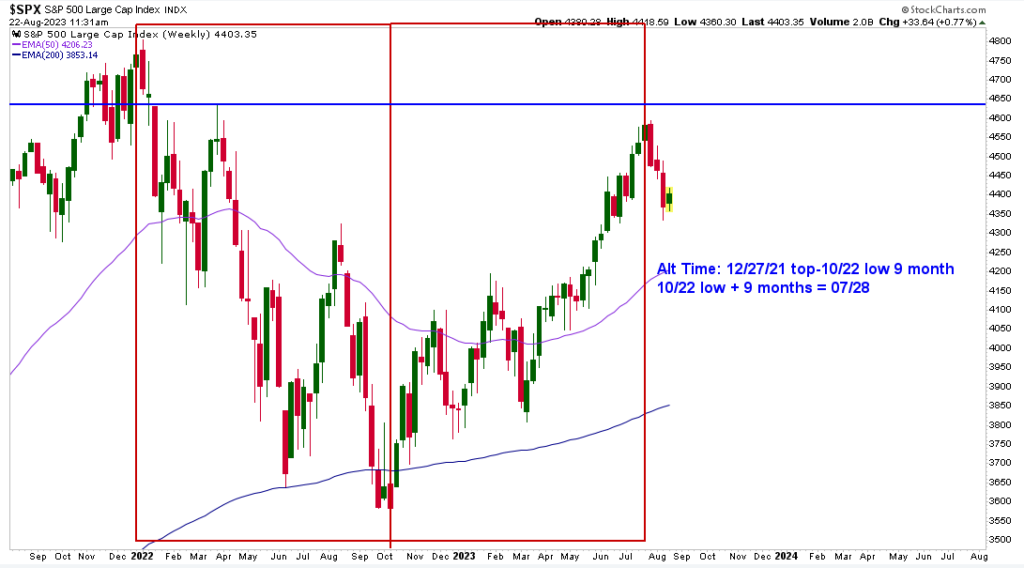
TECHNICAL VIEW by Gary Dean: The SPX did reverse right at the “alt Date” from the timing sequence I have been showing. The primary pattern I am following is the up trending channel on the weekly chart below. That is suggesting a 4200-ish target before all is said and done. If the lower trend line does come into play and is taken out, then we will see a mini crash type move down to the 4000 or lower. That is down the road and we will see big bounces along the way. I will remain on scaling in out on the downside until we see a low forming. Until then, remains with your eyes open and don’t fall in love with the downside or upside. Just trade what the Predictive Analytics Model is suggesting and remain patient.
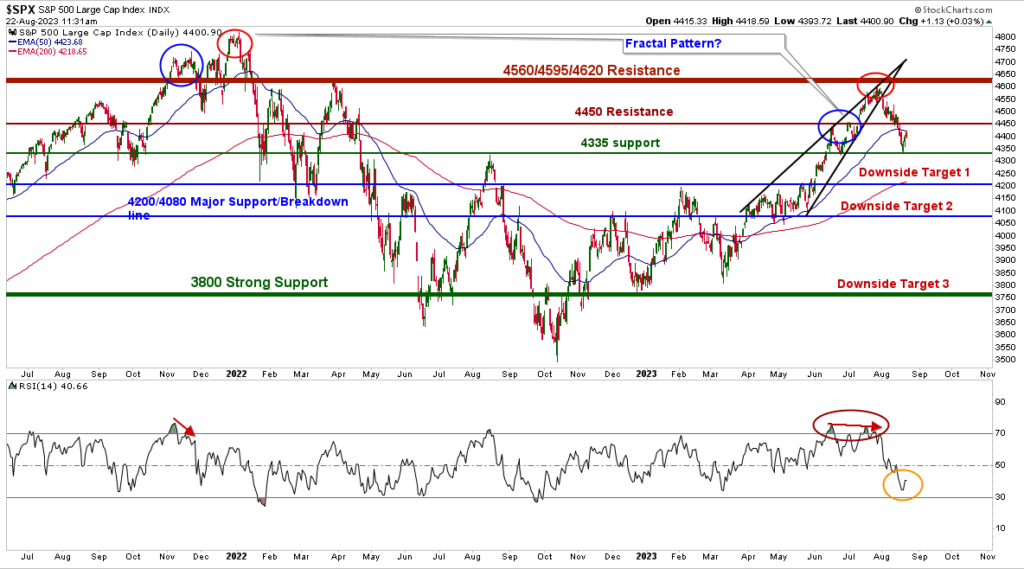
The MINOR change I made from last week, well we needed to see the top and so far, it has.
The 4440 support was important, which I identified for quite some time. Once that was taken out, we did see the reaction trade take the SPX EXACTLY INTOO MY 4335 SUPPORT LINE! That is why I decided to take 1/2 the short trade off. Support was right there and we had some buy signals on the 60’s and that ended up being the exact low. Now we are in the chaos and confusion phase of this bounce. This is to confuse both the perma bears/bulls that are committed to their beliefs. I stay away of taking any side during this phase, it will most definitely raise your blood pressure and cause you stress. I still LIKE the 4450/4480 getting tested before we roll over.
The bullish divergences did kick in and we have seen the bulls take the SPX up close to 100 points from our 1/2 exit. I am NOT convinced the bulls are done-even though I did mention aggressive traders could take a 1/4 size short at 4420. That was the exact high so far. I am leaving the door open for a test of 4450/4460 before sellers step in again, but I am NOT married to that pattern.
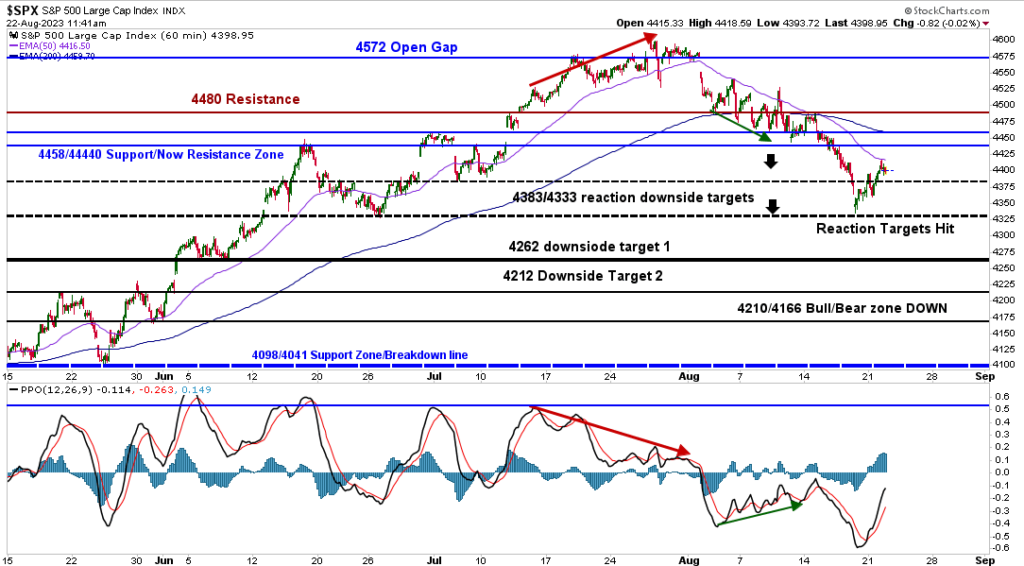
Summary: The exiting of 1/2 the position worked out as planned. We did get a reversal today, but there are no buy/sell signals. That is suggesting we are in the chaos and confusion phase of this bounce. Stay patient and lets see if we can get short at higher levels. G
Sentiment Timing August Special Gold Report. By Gary Dean
Primary Factors That Move Gold:
Gold is a unique and widely recognized precious metal that has historically been considered a safe-haven asset and a store of value. The price of gold can be influenced by various factors, and the top reasons it moves higher include:
1.Geopolitical Uncertainty: Gold tends to perform well during times of geopolitical instability, as investors seek safe-haven assets to protect their wealth from potential risks and uncertainties arising from conflicts or geopolitical tensions.
2.Economic Uncertainty: During economic downturns or periods of economic uncertainty, investors often turn to gold as a safe-haven investment. Gold is considered a hedge against inflation and currency devaluation, as it retains its value when fiat currencies may lose purchasing power.
3.Central Bank Policies: Actions taken by central banks, such as interest rate decisions, quantitative easing, or currency interventions, can impact gold prices. Lower interest rates or expansionary monetary policies can boost gold demand as investors look for alternatives to traditional low-yield investments.
4.Currency Fluctuations: Gold is priced in U.S. dollars, so fluctuations in major currencies can influence its price. A weaker U.S. dollar generally makes gold more attractive to international investors, leading to higher demand and prices.
5.Investor Sentiment: Market sentiment and investor perceptions of risk and uncertainty can drive demand for gold. When investors are concerned about market volatility or potential financial crises, they may allocate more of their portfolios to gold.
6.Global Crisis: Gold often performs well during times of global crises, such as the 2008 financial crisis or the COVID-19 pandemic. During these periods, investors seek the safety and stability that gold can provide.
7.Supply and Demand Dynamics: Changes in gold supply or demand can impact its price. Gold production levels, mining costs, and jewelry demand are factors that affect the overall supply and demand balance.
8.Interest Rates: While low-interest rates can support gold prices, a sudden increase in interest rates might lead to a temporary decline in gold prices, as investors may prefer higher-yielding assets.
9.Inflation Expectations: If investors anticipate rising inflation, they may turn to gold as a hedge against eroding purchasing power.
•It’s important to note that the gold market is influenced by a combination of factors, and its price can be highly volatile. As with any investment, the value of gold can go up or down based on market conditions, and investors should conduct thorough research and consider their risk tolerance before investing in gold or any other asset.
My Reasons For Liking Gold/Silver Long Term
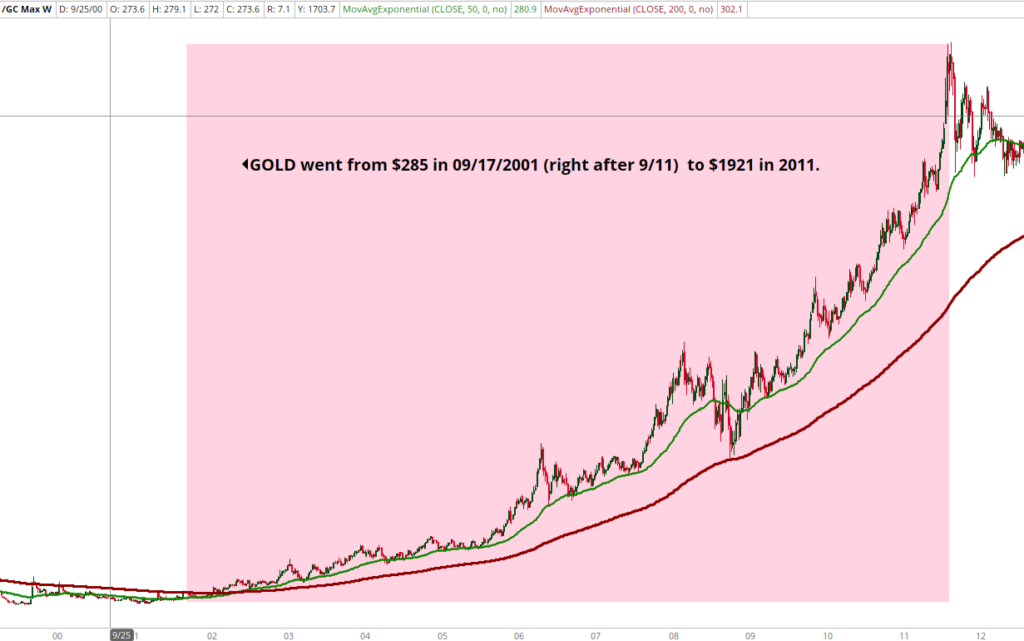
I am bullish long term on gold/silver because of Geopolitical Uncertainty, being my number 1 reason. My forecast is for Gold/Silver to make an important top between 2026 (earliest) and 2032 (Latest) From my technical view, I am looking for GLD (Gold ETF) to make an important top between 240 and 310, which is a very nice % move from current levels (183) A rising tide takes all boats. The same applies to sectors/indices/precious metals. If GLD heads to the minimum target of 240, that is a 32% increase within the next 3 years. The stocks I like have high odds to move much higher than GLD, so expecting a 50%-100% gains from the current levels, would not surprise me. That is NOT a guarantee, just a projection.
1.Geopolitical Uncertainty: Gold tends to perform well during times of geopolitical instability, as investors seek safe-haven assets to protect their wealth from potential risks and uncertainties arising from conflicts or geopolitical tensions. The chances of us living through WWIII are increasing each and every day. The unfortunate truth is the Russia/Ukraine war can be over in 24 hours, like “some” have said. If Ukraine simply says, we will not join NATO, this war ends instantly. I am NO expert on this subject and this is just my option. China invading Taiwan is yet another concern that COULD trigger WWIII, as well as North Korea, Iran getting their hands on Nukes and many other factors. Gold is a trading instrument and will move higher and lower. But contrary to what many gold bugs say, inflation is not the primary reason that moves gold higher, it is geopolitical uncertainty, especially when it is war, moves gold .
2.Economic Uncertainty: During economic downturns or periods of economic uncertainty, investors often turn to gold as a safe-haven investment. Gold is considered a hedge against inflation and currency devaluation, as it retains its value when fiat currencies may lose purchasing power. Many analysts are on both sides of the fence on this one. But me personally, I do believe we will head into a recession and those odds increase if the left maintains in control. They want fossil fuel gone and that will jump start inflation even more and crush our economy.
3.Currency Fluctuations: Gold is priced in U.S. dollars, so fluctuations in major currencies can influence its price. A weaker U.S. dollar generally makes gold more attractive to international investors, leading to higher demand and prices. The only thing I know about this, is that the CBDC (Central Bank Digital Currency) is much closer than you think. It will be a disaster and it will cause “Currency Fluctuations” around the world.
4.Inflation Expectations: If investors anticipate rising inflation, they may turn to gold as a hedge against eroding purchasing power. Inflation has come down, but core inflation is sticky. If Oil moves higher (It is) then inflation will start to move higher again. If left wins in 2024, inflation will be at level s never seen before.

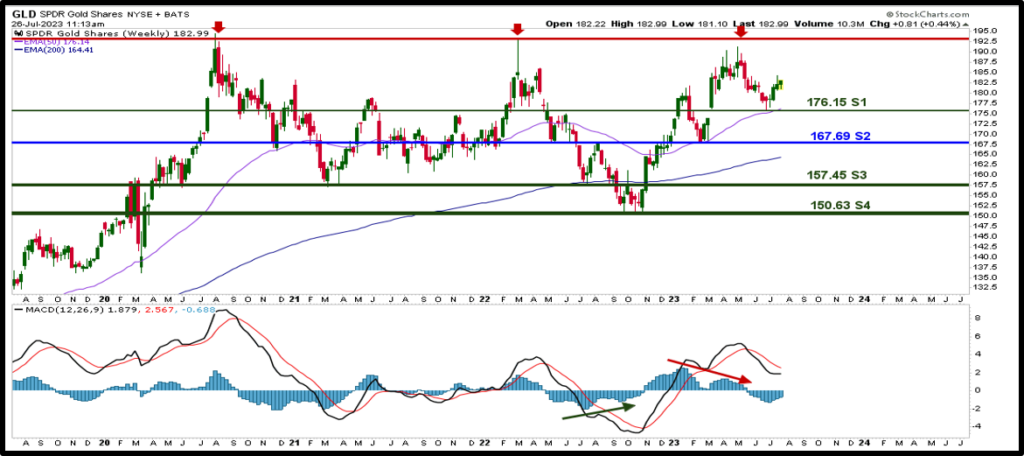
Looking at GLD on the weekly charts, I do see a sell signal, which brought GLD down from 190-ish to 176.15. That MAY be the low, but I am leaving the door open for a move down to 167.69. I will be using any weakness to buy all the way down to 150.63. If GLD breaks above the 194.45, it will be breaking out and the support levels will not come into play.
Conclusion: Leave the door open for some more backing and filling and buy on weakness at support pivots. A break above 194.45 is a breakout and buy the breakout.
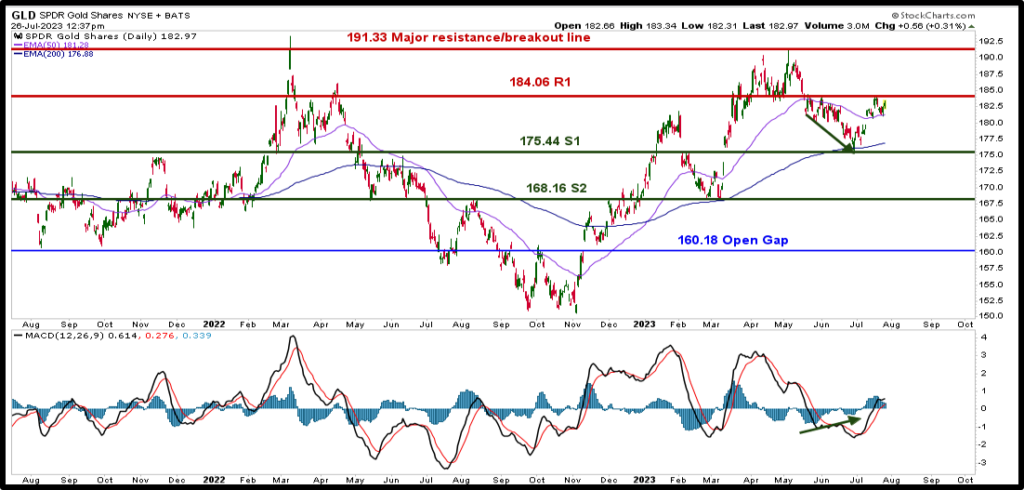
The daily charts are showing buy signals as GLD touched the 200 dma. Being the weekly chart is showing some sell signals, opens the door for a test of the 168.16 or closing the gap at 160.18. Don’t fight the breakout if that comes first (Above the 194.45)
Looking at GLD with Time/Price Sequence, we can see how I produced my upside target. The time piece is showing a top coming in some time between 2026/2027. If that time period does NOT hold down GLD, then we will be looking at a move into 2032 with a 310 top. Time sequence-Low 11/23/2015 -top 08/03/2020. Forecast sequence: Low 10/17/2022-Top 10/17/2027
(AU) Anglo Gold Ashanti Headquartered in Johannesburg, South Africa, is a gold mining company operating mines across Africa, Australia, and the Americas. Despite a more conservative earnings forecast compared to other mentioned companies, AngloGold has an impressive track record of consistently increasing its earnings per share (EPS) since 2015. Though there was a slight sales dip in 2021 versus 2020, overall sales have been on an upward trend since 2018. Over the past decade, AU’s share price has generally remained within a specific range, but it stands out among gold stocks by currently trading above its 200-day moving average. In 2023, the stock experienced a pullback after a significant rally in late 2022. AngloGold Ashanti offers a dividend yield of 2.4%, with the dividend amount subject to significant variation from year to year. Currently, the company’s price-to-earnings (P/E) ratio is 28.7, which is considered moderate for this stock.
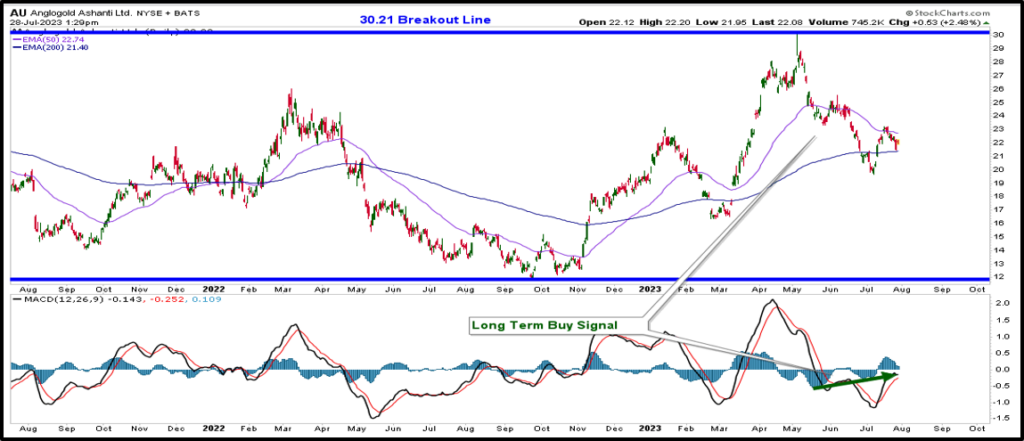
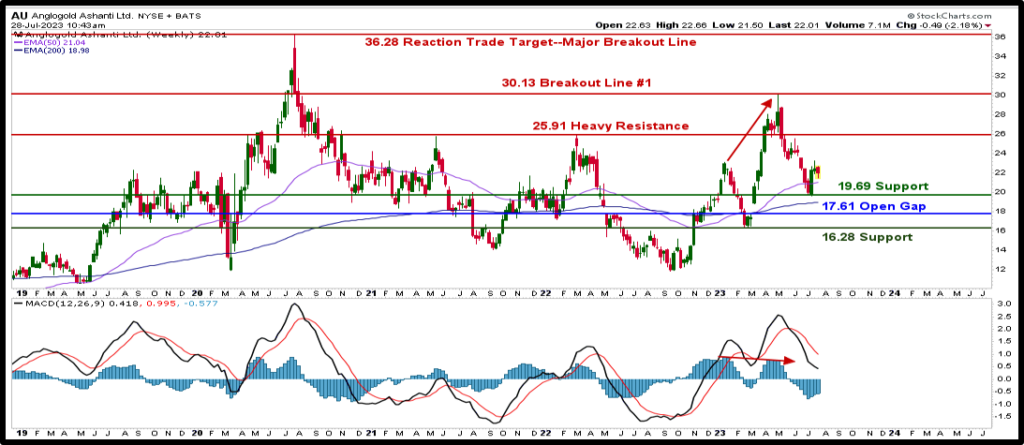
AU is one of my favorite gold stocks to invest in for the long term. It is currently trading at 22.27 and as you can see on the chart, just making it back to the breakout line #1 (30.13) is a 35% gain. Once it breaks through that resistance pivot, we should get a reaction trade up to the major breakout line 36.28. That is a 62% move. Being I see GLD making new all-time highs heading into 2026, a move above 36.28 is very likely. If we need more backing and filling because of the weekly sell signals, I will be buying dips at support levels below– down to 17.61/16.26 (open gap-blue line) would be a gift.
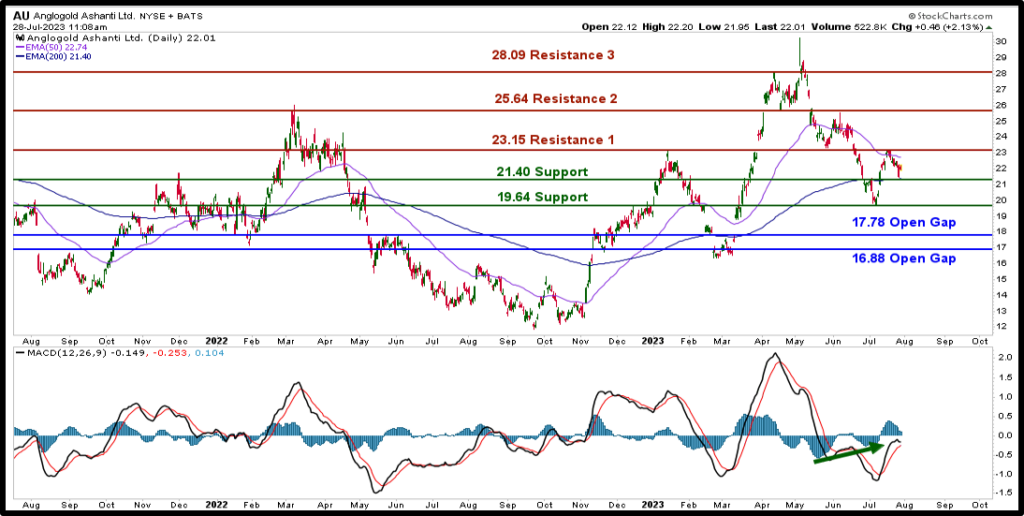
Looking at AU on the daily chart, you can see we had buy signals at the 19.64 lows and saw a nice bounce up to the 23.15 resistance. Support is at 21.40 and then 19.64. Be careful of the open gaps below at 17.78/16.88. I am going to be a buyer on weakness at the 21.40/19.64 and will leave the door open to buy at 17.78/16.88. This is long term, so be patient. Above 25.84, expect 28.09 to get tested.
(GFI) Gold Fields Limited is a South African-based company, operates gold mining ventures in multiple countries, including South Africa, Ghana, Australia, and Peru. In recent times, Gold Fields has proven to be a consistent performer,
witnessing sales growth since 2016 and an increase in earnings per share (EPS) since 2019. Analysts project a moderate yearly growth trajectory for the company in the future. During 2019 and 2020, GFI experienced a notable rally, but it has since stabilized, trading within a range of $7 to $17. Currently, the stock price is situated near the lower end of this range. Among the listed companies, Gold Fields offers the highest dividend yield at 3.9%. However, like many other gold-related stocks, the dividend payment may fluctuate from year to year. With a price-to-earnings (P/E) ratio of 14.1, GFI’s valuation is relatively low compared to the readings observed over the last five years. The lowest P/E reading was just below 7.0, recorded in late 2022.
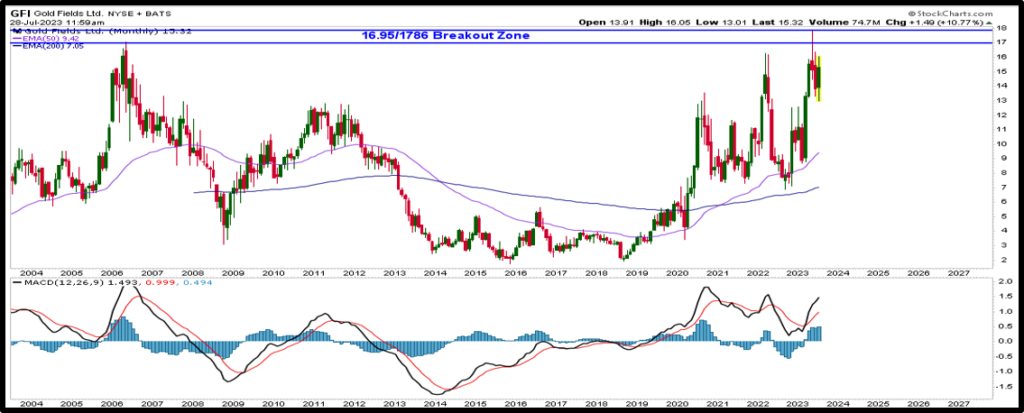
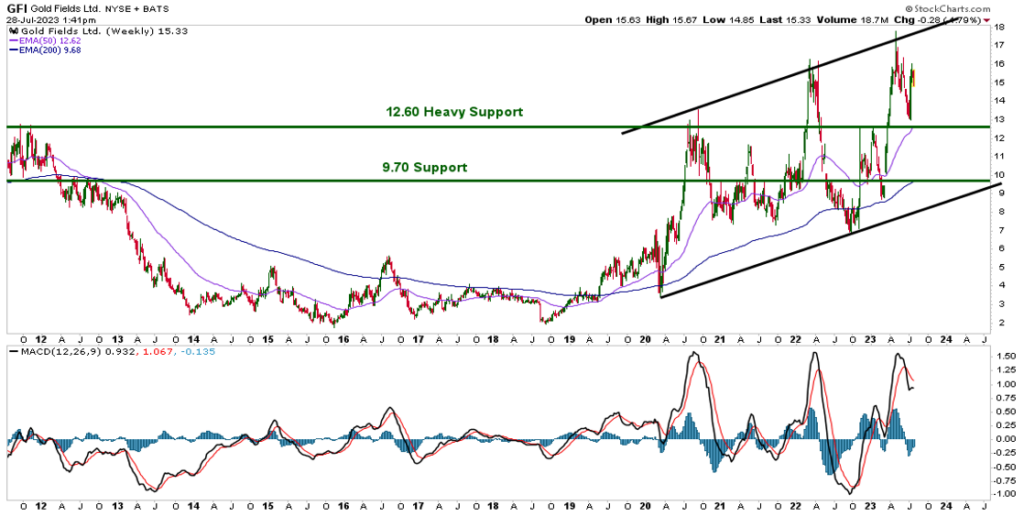
(GFI) Weekly is trading within a very large up trending channel and is a bit overbought. I am going to wait and see if I can start building my long position closer to the 12.60 support. I see this stock trading in the 30’s or higher come 2026/2027. I am going to be patient, but not try and be perfect. As you can see, it has some big moves in both direction and the last one looks like it is a top—for now. If it does follow this channel, then the low 10’s would be the next stop. Don’t chase this here, but it is a stock for a long-term investment and will look to build on weakness.
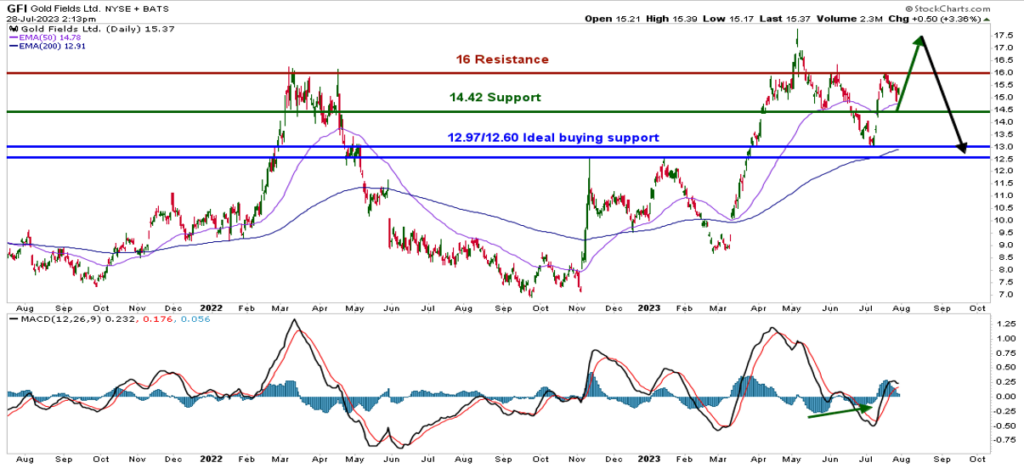
(GFI) Daily is a little tricky to forecast short term movement. There were bullish divergences at the 13 low, and we saw a nice bounce into resistance at 16. There is a CHANCE we are making an inverted head/shoulder (bullish) which would take GFI towards the 17.50 highs or higher. But if looking at this as a long-term investment, one can dabble very small, but I am waiting for a pullback down to the 14.50 13.00/12.60 support zone.
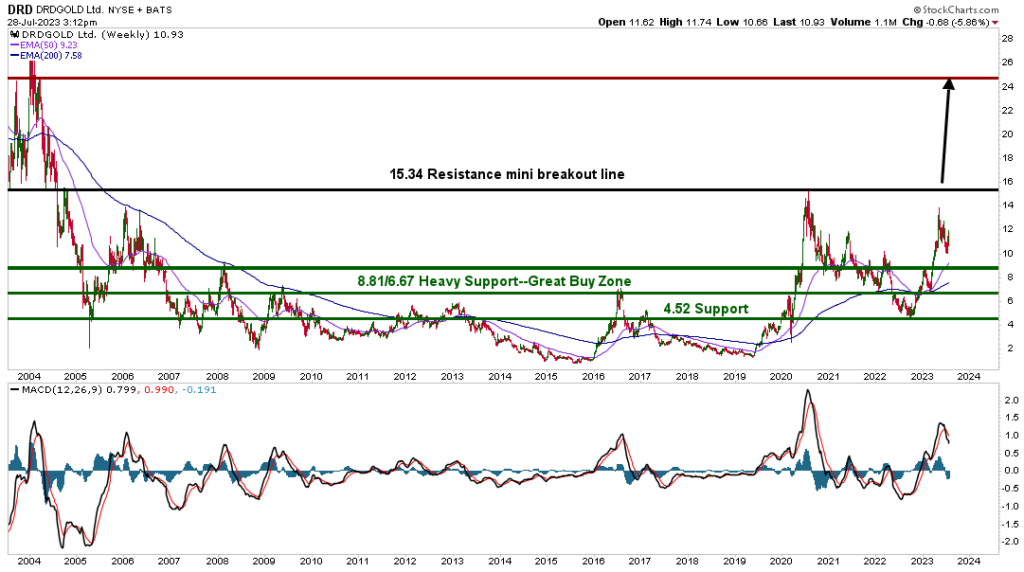
(DRD) DRDGold, another South African company, focuses on gold extraction and processing from two properties in South Africa.
Over the years, the company has consistently increased its sales since 2015, with only a few minor setbacks. Moreover, its earnings per share (EPS) has been positive for the last four years, showing an overall upward trend, albeit lower in 2022 compared to 2021.
DRDGold experienced a remarkable rally of nearly 900% between mid-2019 and mid-2020. However, it has since been retracing from that peak. Presently, the company offers a dividend yield of approximately 3.0%, though the dividend amount varies from year to year.
The current price-to-earnings (P/E) ratio stands at 11.2, representing one of the lowest readings observed over the last five years.
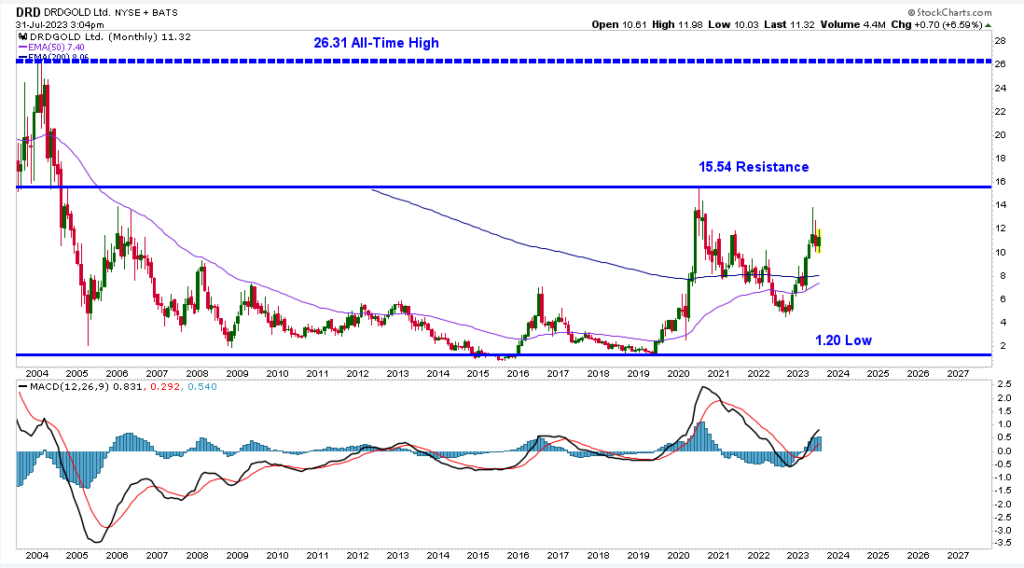
(DRD) Weekly DRD is another stock I would either wait for a breakout (above 15.34) for a move up to 24.50. But that is more of a trade set up. I like buying weakness/dips between 8.81/6.67 and leaving some powder for a chance to buy near 4.52. It is quite overbought and SMALL sell signals. It is a highflyer and moves quickly. But risk/reward for long term investment, looks good.
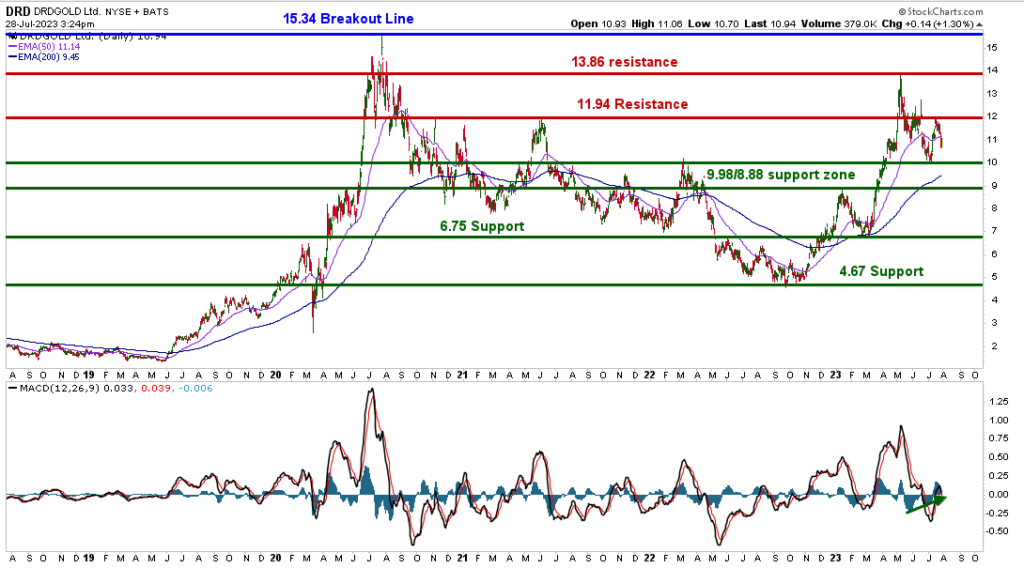
(DRD) Daily is another kind of hard to forecast short term. If it gets above 15.34, it will be breaking out and heading to the 24’s. I would like to buy dips between 9.98/8.88 and then leave some powder dry for a possible test of 6.75/4.67. I do see the 24’s or higher coming into play by 2026/2027
Remember, this is a long term investment and the stocks may fluctuate during this time. But take the slow and steady approach and I will be buying these stocks at pivots on wea
Information is for paid subscribers & may not be copied or distributed. © Copyright 2023. The information contained herein was provided by Sentiment Timing and/or its publishers does not make any representation or warrant with regard hereto, including but not limited to those of accuracy, completeness, reliability, timeliness and/or infringement on the rights of third parties. This Publication expresses a view on the markets but is not intended to provide any specific recommendation to buy or sell any security. Investing is Uncertain and always carries Risk. Of Losses. Subscribers should always assess Market Risk parameters with their broker or financial adviser.
Information is for paid customers and may not be copied or distributed Copyright 2023
