
LIQUIDITY MATRIX
A COMPLETE MARKET INTELLIGENCE SYSTEM
See the Liquidity. Understand the Market. Identify the Opportunity.
Six proprietary indicators, daily Morning Notes, weekly market analysis, and a 24/7 interactive trading community, all in one membership.
Designed to help active traders interpret market conditions, identify potential opportunities and make more informed decisions.
Accelerated historical TradingView replay for illustration. Not live trading and not a guarantee of future results.
One membership includes everything: all six IPM indicators, daily Morning Notes with pivots and potential turn dates, a weekly market video analysis, and access to the 24/7 interactive trading community. $49.99 for your first 30 days.
See the Market Through Liquidity.
Price moves when buying and selling pressure shifts. IPM Liquidity Matrix brings volume, momentum and key price levels into one view, so you can see where pressure is building, where moves may be stretched, and which levels matter. Understand the levels. Evaluate the signals. Make your own decisions.

Actual TradingView screenshot supplied by IPM · IPM logo added as a website overlay · Historical chart, not a live feed
Six Tools. One Matrix.
Every membership includes the full suite. Each tool answers a different question about the market, and together they give you trend, turning-point and market-structure context on one chart.
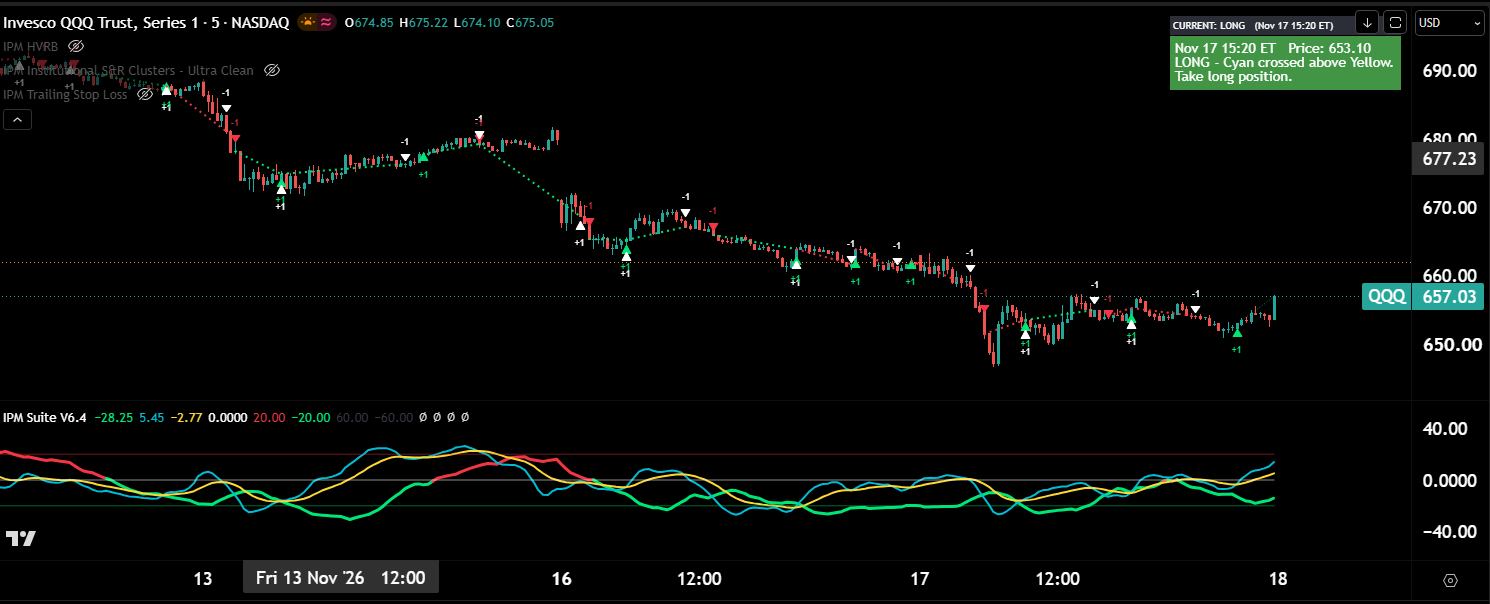
IPM Liquidity Ribbon Cross
The primary directional signal system. Proprietary liquidity ribbon calculations and crossovers highlight potential changes in market direction directly on your chart.
Learn more: how traders use it
- Visual ribbon crossovers
- Potential buy and sell signals
- Trend direction and directional changes
- Volume-weighted trend filtering
- Clear signals plotted on the price chart
What it detects: Changes in direction, shown when the liquidity ribbon lines cross on the price chart.
Why it matters: It is the main signal of the suite. It gives you one clear read on which way pressure is flowing.
How a trader might use it: Use it as the starting point for direction, then check the other tools for confirmation before acting.
Signals are analytical observations. You decide whether and how to trade them.
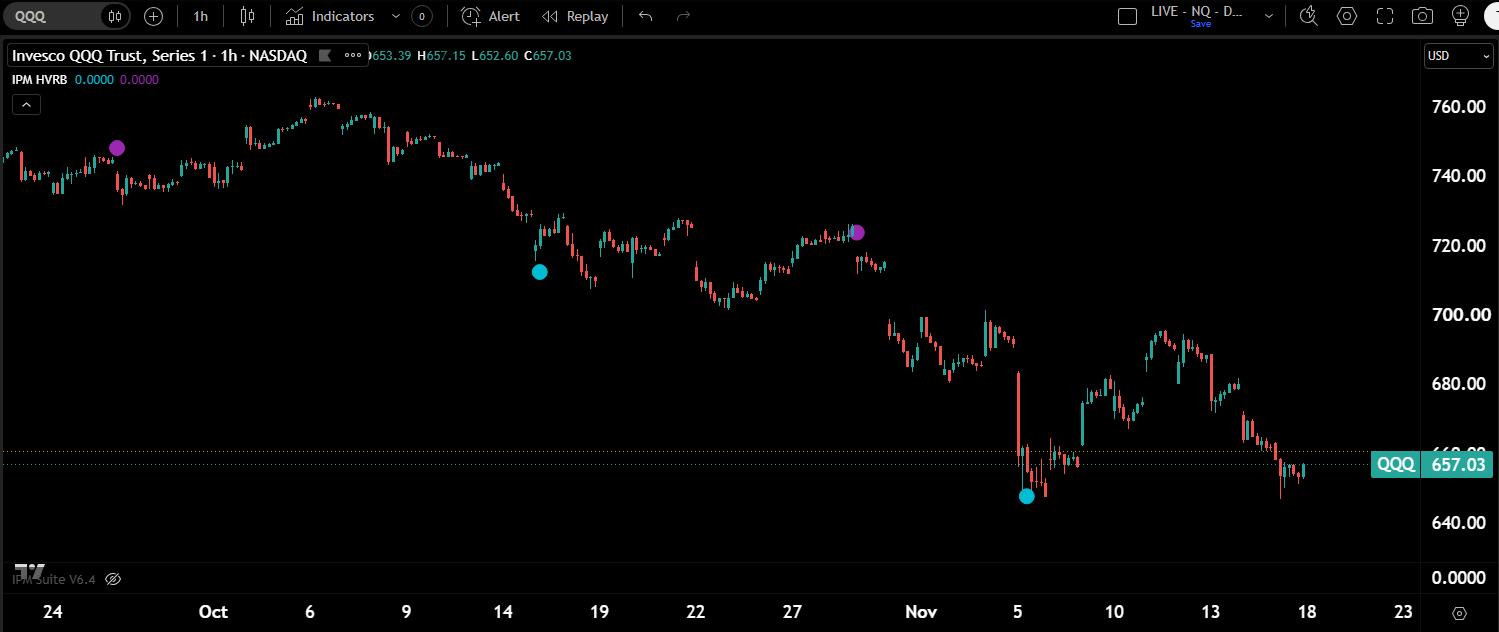
High Volume Reversal Bars
Highlights unusual trading-volume activity that can be associated with potential market turning points.
Learn more: how traders use it
- Identifies high-volume price bars
- Highlights potential exhaustion conditions
- Helps you recognize possible reversals
- Best evaluated alongside key support and resistance
What it detects: Price bars with unusually high volume that can show up near potential turning points.
Why it matters: Heavy volume at the end of a move can be a sign that buyers or sellers are becoming exhausted.
How a trader might use it: Watch for these bars at key support or resistance levels as an early warning that a move may be stalling.
Not every high-volume bar leads to a reversal.
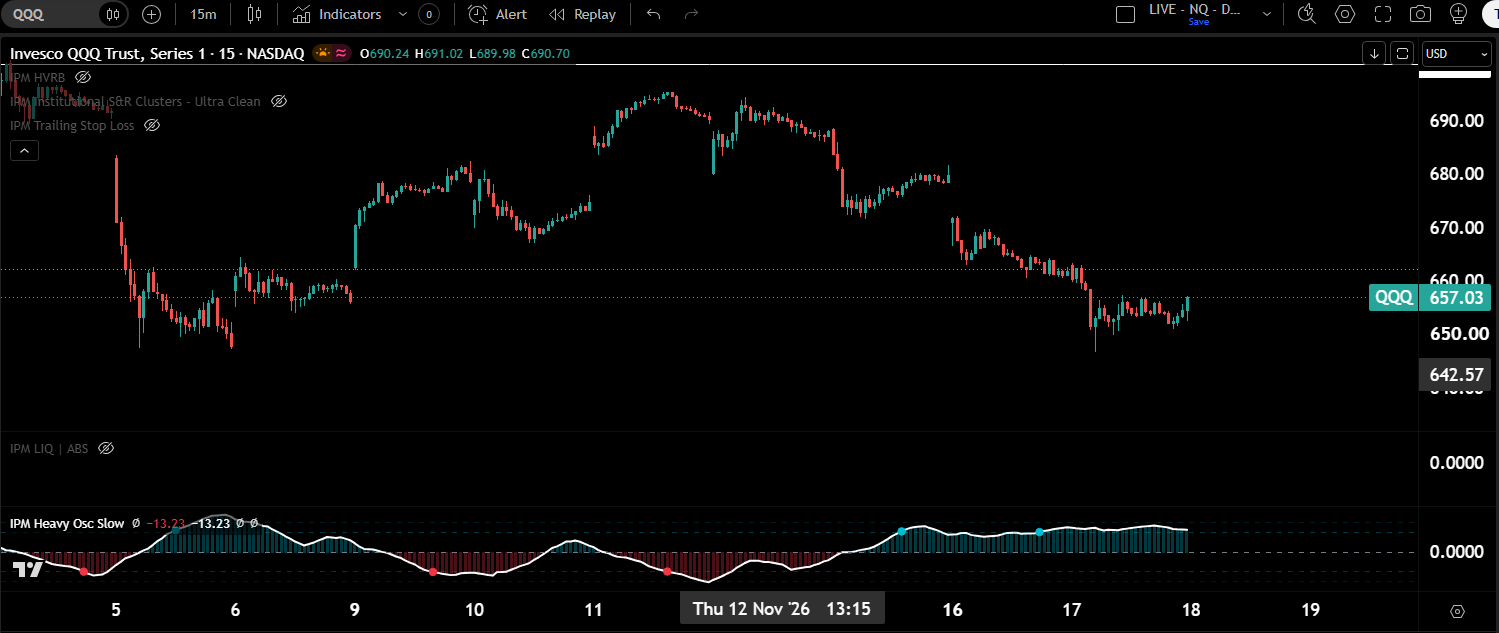
IPM Heavy Liquidity Oscillator
A proprietary oscillator for evaluating momentum, liquidity conditions and potential market extension.
Learn more: how traders use it
- Positive and negative momentum histogram
- Overbought zones in red, oversold zones in green
- Potential exhaustion warnings
- Gauges the strength or weakness of a move
What it detects: Momentum, trend strength and stretched (overbought or oversold) conditions.
Why it matters: It helps you judge whether a move still has strength or may be running out of fuel.
How a trader might use it: Use extreme readings as a caution flag rather than a signal on their own, especially near key levels.
Extreme readings can persist during strong trends.
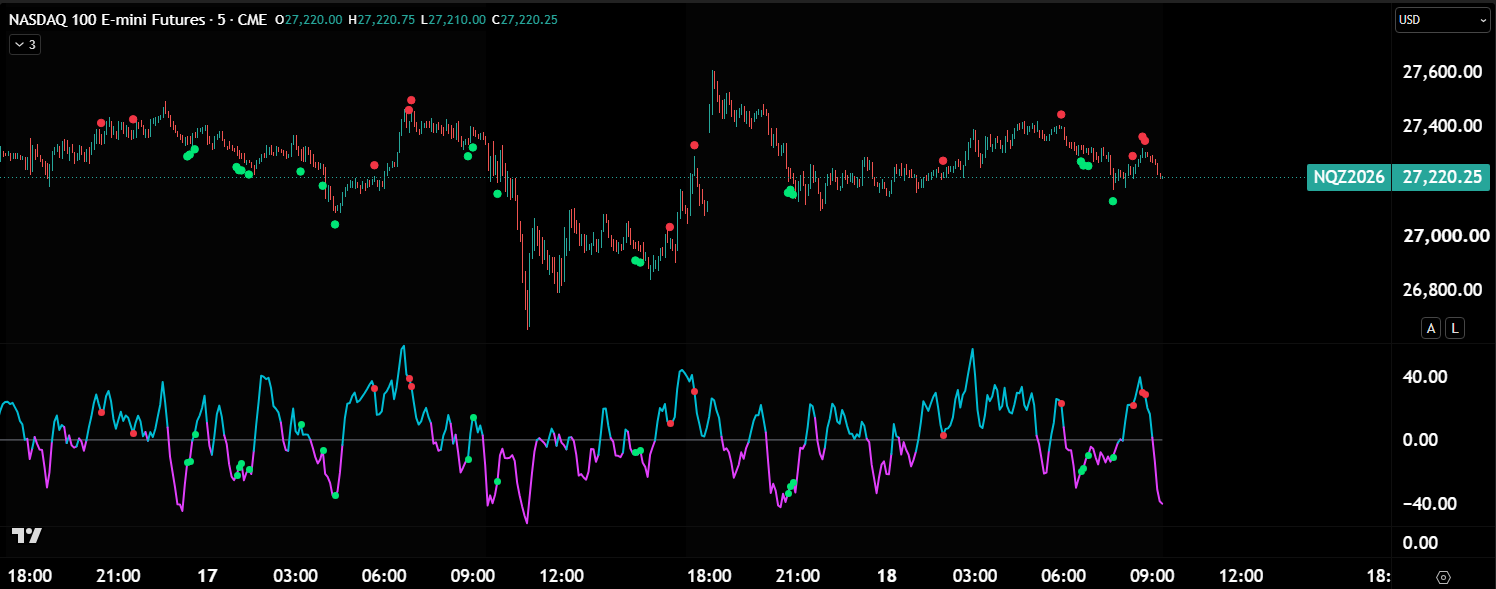
IPM Liquidity Divergence
Flags divergences between price behavior and the underlying liquidity and momentum calculations.
Learn more: how traders use it
- Potential bullish divergence
- Potential bearish divergence
- Warnings of weakening momentum
- Complements Reversal Bars and the Heavy Oscillator
What it detects: Times when price keeps moving one way while measured market pressure starts moving the other way.
Why it matters: A divergence can be an early sign that the pressure behind a move is weakening.
How a trader might use it: Look for divergence near support or resistance and wait for confirmation, such as a Ribbon Cross change, before acting.
Divergence is an analytical observation, not a guaranteed reversal signal.
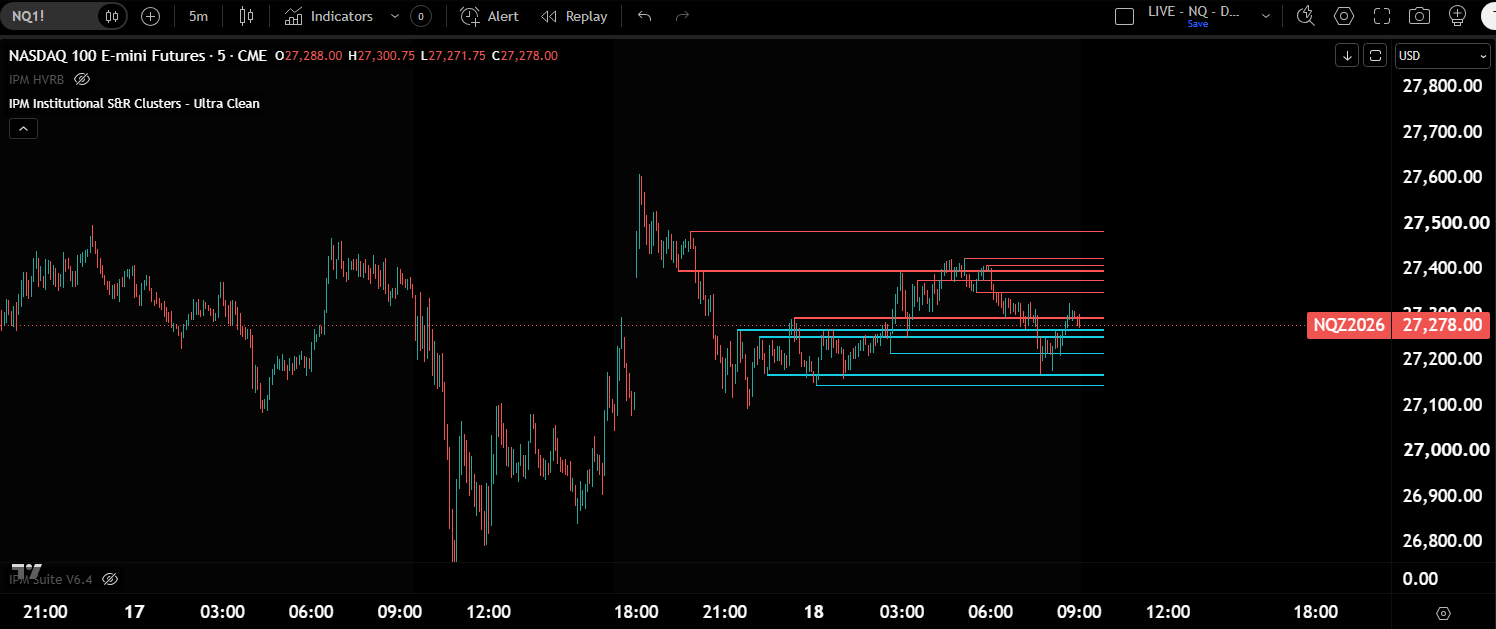
IPM Institutional Support & Resistance Clusters
Automated support and resistance. The levels appear on your chart automatically, with no manual drawing, and highlight areas where several support and resistance levels overlap.
Learn more: how traders use it
- Levels drawn automatically on your chart
- Support and resistance zones
- Clusters of potentially significant levels
- Potential reaction areas
- Context for entries, exits and risk planning
What it detects: Support and resistance areas, identified automatically and drawn on your chart.
Why it matters: Price often reacts at these levels, so they help you plan where to enter, take profit or set risk.
How a trader might use it: Use the clusters to mark potential reaction areas before the session, then watch how price behaves when it reaches them.
"Institutional" is a product name. It does not indicate verified institutional orders.
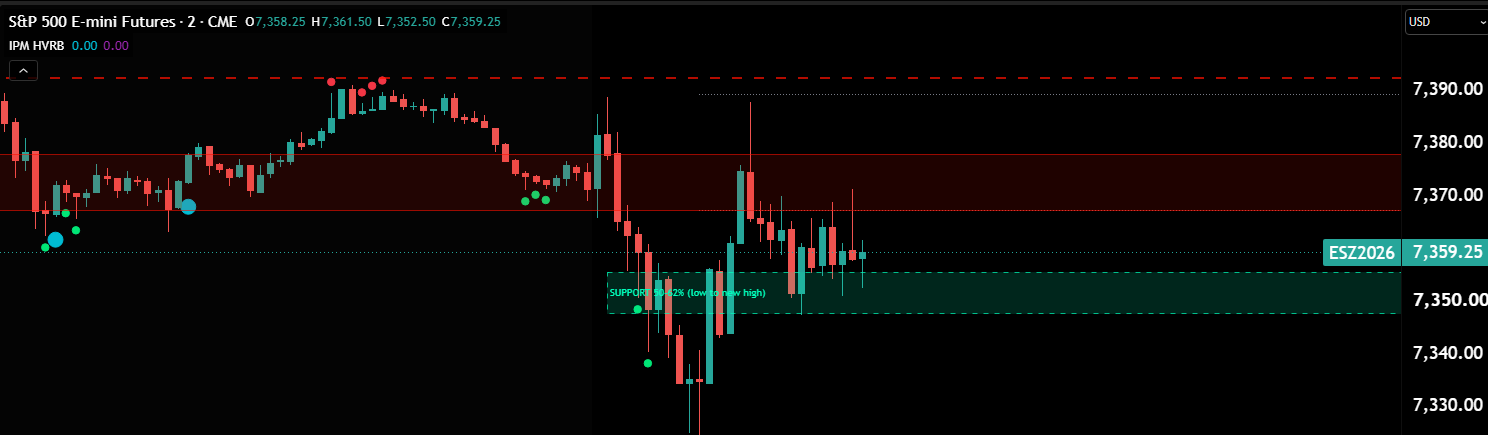
IPM Automated Accumulation/Distribution Zones & Target Lines
Automatically draws the price zones where buying (accumulation) or selling (distribution) has been concentrated, then projects upside and downside target lines from those zones. No manual drawing required.
Learn more: how traders use it
- Accumulation zones: areas where buying activity has built up, which can act as potential support
- Distribution zones: areas where selling activity has built up, which can act as potential resistance
- Downside target lines: projected levels price may move toward after a distribution zone
- Upside target lines: projected levels price may move toward after an accumulation zone
- Updates automatically as new price data comes in
What it detects: Zones where buying or selling has been concentrated, plus projected upside and downside target lines.
Why it matters: The zones show where pressure built up, and the target lines give you possible levels to plan around.
How a trader might use it: Use the target lines as potential profit-taking or planning levels, and the zones as areas where price may react.
Zones and target lines are calculated from chart data. Targets are potential levels, not predictions, and price may not reach them. "Accumulation" and "distribution" do not indicate verified institutional orders.
See How the IPM Indicators Work Together.
The Liquidity Ribbon Cross is the main signal. The other tools add context around it. Here is an example of how they can line up on one chart.
- LevelQQQ approaches an automatically identified resistance level from the Support & Resistance Clusters.
- VolumeA High Volume Reversal Bar appears at that level.
- PressureLiquidity Divergence suggests the pressure behind the move is weakening.
- MomentumThe Heavy Liquidity Oscillator shows potential exhaustion.
- DirectionThe Liquidity Ribbon Cross changes direction.
See the liquidity trend
Use hourly or daily charts to see which way liquidity is flowing and where the major zones and levels sit.
Refine entries and exits
Switch to shorter charts, such as 2-minute or 5-minute, to time more precise entries and exits in the direction of that trend.
This is an example scenario to explain how the tools relate to each other. It is not a recommendation or a record of a real trade. Signals do not always line up, and a setup like this can still fail.
Start Every Trading Day Prepared.
Start your trading day with a clear understanding of the markets. Our Morning Notes highlight important price levels, upcoming catalysts and potential trading scenarios so you can approach the session with a structured plan.
- Market outlook for the day
- Daily pivot levels
- Potential turn dates
- Technical analysis of ES, NQ and other markets when relevant
- Key support and resistance levels
- Scheduled economic events and catalysts
A real Morning Notes sample will be shown here. Levels are left blank on purpose, so nothing here is invented market analysis.
The Weekly Market Intelligence Report.
Every week, we break down what happened in the markets, examine the most important liquidity developments, and identify the technical levels and conditions worth watching in the week ahead.
- Review of major market moves and liquidity events
- Important technical developments and level reactions
- Selected trading setups reviewed
- Opportunities, risks and key levels for the week ahead
Sample Weekly Market Video Report (about 6 minutes). Historical market review for educational purposes, not a recommendation or a guarantee of future results.
A Trading Community That Never Closes.
24/7 Access. Shared Charts. Market Insights. Real Trader Discussions.
Trading doesn't have to be a solo experience. View shared market charts, discuss important price levels, exchange trading ideas and ask questions. Gary periodically shares his charts, market observations and pivot points, and members add their own analysis and perspectives.
"24/7" means the community is open any time. It isn't staffed around the clock, and it isn't a room promising constant trade calls. It's a collaborative space built around learning and discussion.
TradingView and MultiCharts.
One membership covers either platform, or both. You choose at checkout.
Invite-only access
- Choose TradingView at checkout and enter your TradingView username.
- We add your username to the IPM invite-only indicators.
- Open TradingView → Indicators → Invite-only scripts, and add the tools.
Protected study files
- Choose MultiCharts at checkout.
- You receive protected, read-only study files and setup instructions by email.
- Import them into MultiCharts and apply them to your chart. Requires the standard MultiCharts edition (PowerLanguage). The files do not run in MultiCharts .NET.
Access is set up by our team after checkout. Availability of each indicator depends on the platform.
Everything Included. One Subscription.
Get full access for $49.99 for your first 30 days, then continue monthly or quarterly. Both plans include exactly the same membership.
- Liquidity Ribbon Cross signals
- High Volume Reversal Bars
- Heavy Liquidity Oscillator
- Liquidity Divergence
- Support/Resistance Clusters
- Accumulation/Distribution Zones & Target Lines
- Daily Morning Notes
- Weekly Market Video Report
- 24/7 Interactive Trading Community
- TradingView and/or MultiCharts
MONTHLY
After the $49.99 introductory 30 days
- IPM Liquidity Ribbon Cross
- High Volume Reversal Bars
- Heavy Liquidity Oscillator
- Liquidity Divergence
- Support & Resistance Clusters
- Accumulation/Distribution Zones & Targets
- Daily Morning Notes
- Weekly Market Video Report
- 24/7 Interactive Trading Community
- TradingView or MultiCharts
$49.99 today. Renews at $149.99 monthly after day 30 unless canceled.
QUARTERLY
After the $49.99 introductory 30 days
- IPM Liquidity Ribbon Cross
- High Volume Reversal Bars
- Heavy Liquidity Oscillator
- Liquidity Divergence
- Support & Resistance Clusters
- Accumulation/Distribution Zones & Targets
- Daily Morning Notes
- Weekly Market Video Report
- 24/7 Interactive Trading Community
- TradingView or MultiCharts
- Equivalent to $133 per month
$49.99 today. Renews at $399 every 3 months after day 30 unless canceled.
| Three months of membership | Cost |
|---|---|
| Monthly plan (3 × $149.99) | $449.97 |
| Quarterly plan | $399.00 |
| Quarterly savings | $50.97 |
Comparison uses regular rates and excludes the introductory period. Automated trade execution is not included in either plan.
Frequently Asked Questions
Does IPM Liquidity Matrix automatically place trades?
No. The membership provides analytical indicators and trading signals. You make your own trading decisions and place your own trades.
What is included in the subscription?
The six-indicator suite, Daily Morning Notes, the Weekly Market Video Report and the 24/7 Trading Community. Monthly and quarterly plans include the same benefits.
What do I pay today?
$49.99 for your first 30 days. After 30 days, your selected plan renews automatically at $149.99 per month or $399 every three months unless you cancel first. The renewal amount and date are shown at checkout.
Which platforms are supported?
TradingView and MultiCharts. Availability of individual indicators depends on the platform. You can choose TradingView, MultiCharts or both at checkout. MultiCharts files require the standard MultiCharts edition (PowerLanguage); they do not run in MultiCharts .NET.
How do I get access after I pay?
Our team sets up your access after checkout. TradingView members are added by username to the invite-only indicators. MultiCharts members receive protected study files and instructions by email.
Is the community staffed 24 hours a day?
No. You can access the community at any time. Gary contributes charts and market observations periodically, and members interact with one another.
How do I cancel?
Any time, through the membership management page. Log in with your username and password, then choose Cancel. Cancellation takes effect at the end of your current paid period, and you keep access until then.
Does the system guarantee profitable trades?
No. Trading involves substantial risk, and no indicator or analytical system can guarantee results.
Is automated trading available?
No. Automated trading is not part of this membership. It is a separate private service and is not offered through this page.
Morning Notes & Member Login
Already subscribe to Sentiment Timing? Continue accessing your Morning Notes and member resources through your current login.
More than trading signals. A complete market intelligence membership.
Start Your IPM Liquidity Matrix Membership
Step 1 of 3 · Enter your name and email to continue to the selected plan.
Risk Disclosure & Membership Agreement
Sentiment Timing Publications LLC · Sentiment Timing · IPM Liquidity Matrix
Step 2 of 3 · Please read carefully. You must agree before continuing to secure checkout for the selected plan.
1. Trading Involves Substantial Risk
Trading futures, options, stocks, ETFs and other financial instruments involves substantial risk of loss and is not suitable for every person. You could lose some or all of the money you invest. Because futures are leveraged, losses can exceed your initial deposit, and you may be required to deposit additional funds. Only trade with money you can afford to lose.
2. Indicators Do Not Guarantee Results
The IPM Liquidity Matrix indicators are analytical tools. They are designed to help you identify areas where a potential reversal, support, resistance, trend change or price reaction may occur. They do not predict the future, and they do not guarantee winning trades, profits or the avoidance of losses. Signals, zones, target lines and levels can be wrong, can appear late, and can fail. Results may differ between platforms, data feeds, time frames and market conditions.
3. Education Only, Not Investment Advice
All indicators, signals, Morning Notes, pivot levels, potential turn dates, weekly videos, community posts and other content are provided for general educational and informational purposes only. Nothing provided is personalized investment, financial, legal or tax advice, or a recommendation to buy, sell or hold any security, futures contract or other instrument. Nothing in this membership creates an advisory or fiduciary relationship. Consult a licensed financial professional before making investment decisions.
4. You Are Responsible for Your Trades
You alone decide whether, when and how to trade. You are solely responsible for your orders, position sizes, stop-losses, risk management and all resulting gains and losses. This membership does not include automated trade execution and does not place, modify or manage any orders in your account.
5. Past and Hypothetical Results
Past performance is not indicative of future results. Any chart examples, replays and reviews shown are historical and for illustration only. Hypothetical or simulated performance results have certain inherent limitations. Unlike an actual performance record, simulated results do not represent actual trading. Also, since the trades have not actually been executed, the results may have under- or over-compensated for the impact, if any, of certain market factors, such as lack of liquidity. Simulated trading programs in general are also subject to the fact that they are designed with the benefit of hindsight. No representation is being made that any account will or is likely to achieve profits or losses similar to those shown.
6. Morning Notes, Videos and Community
Market outlooks, pivots, potential turn dates and analysis reflect opinions at the time they are made and may change without notice. The 24/7 Interactive Trading Community is open any time but is not staffed or monitored around the clock and does not provide trade calls. Posts by other members are their own opinions, are not reviewed or endorsed by us, and should not be relied on as advice.
7. Technology and Data
Indicators depend on third-party platforms and data, including TradingView, MultiCharts and data providers. We do not guarantee uninterrupted access, data accuracy or platform availability, and we are not responsible for losses caused by outages, delays, data errors, platform changes or connectivity problems.
8. Limitation of Liability and Release
IPM Liquidity Matrix is provided by Sentiment Timing Publications LLC ("Sentiment Timing"). In this agreement, "Sentiment Timing Parties" means Sentiment Timing Publications LLC, Sentiment Timing, IPM, IPM Liquidity Matrix, its owner and principal Gary Dean, and its members, managers, officers, principals, employees, contractors, agents, affiliates, successors and assigns.
To the fullest extent permitted by law, the Sentiment Timing Parties are not responsible or liable for any trading losses, lost profits, or any direct, indirect, incidental, special or consequential damages arising from your use of, or reliance on, the membership, indicators, signals, Morning Notes, videos, community or any other content, even if advised of the possibility of such losses. The membership and all content are provided "as is" and "as available," without warranties of any kind.
You voluntarily assume all risks of trading and release the Sentiment Timing Parties from any claims related to your trading decisions and results. You agree to indemnify and hold harmless the Sentiment Timing Parties from any claims, losses or expenses arising from your trading, your use of the membership, or your violation of this agreement. If any liability is found despite these terms, the total liability of the Sentiment Timing Parties is limited to the membership fees you paid in the 3 months before the claim.
9. Subscription and Billing
You will be charged $49.99 today for your first 30 days. Unless you cancel before the 30 days end, your plan renews automatically at $149.99 per month (Monthly) or $399 every 3 months (Quarterly) until you cancel. You can cancel any time through the membership management page; cancellation takes effect at the end of your current paid period. Refunds are subject to our Fulfillment and Refund Policy.
10. Personal Use Only
Your membership is for your personal use. You may not share your access, logins, indicators, Morning Notes, videos or community content, or attempt to copy, resell or reverse-engineer the indicators. Access may be removed for violations without refund.
11. Your Agreement
By checking the box and clicking "I Agree," you confirm that you are at least 18 years old, that you have read and understand this Risk Disclosure & Membership Agreement, our Disclaimer and our Privacy Policy, and that you accept all of the risks and terms described above.
